Visualising information in the pre-digital age

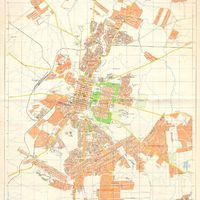
Before the advent of digital technology, maps were the way to visualise data in beautiful and simple ways that brought out the unseen patterns between things. The Talbot Map Collection is a vast repository of printed maps that illustrate the terrain of the past.
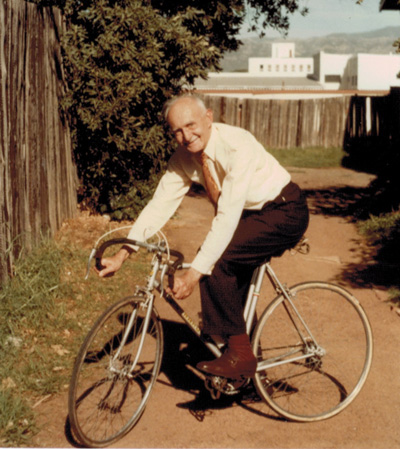 The man who made the Atlas
We humans take in most of our information visually, and maps were the form of data visualisation we had in the pre-computer era. They helped us to visualise things spatially, make visual correlations and grasp the links between different phenomena. There is so much information in maps. They encourage you to be holistic – to see things in their totality and not to split things. It’s a spatial arrangement that reflects the terrain, the geology, the human usage and how they all integrate together.
‘On Google Earth they’ve introduced a feature where can go back and look at old imagery, but you can’t do the same with maps.’
One of the most significant facts underlying the digitisation of the Talbot Map Collection is that we have had a complete change of technology from the time when [William John] Talbot was Professor of Geography at the University of Cape Town to where we are today. It’s a stretch to imagine just how important a role paper maps – physical maps – used to play. When I did my undergraduate work, at least half the year would be spent on map interpretation.
Now we go to Google Maps and Google Earth and we can get all the maps spatial information we need. Maps are ubiquitous now, whereas in Talbot’s day you couldn’t easily get them. You had to go and draw them yourself because a lot of them were simply not available, or you had to go and buy a paper map and take it around with you.
Now that we have digital technology, we tend to forget that digital maps are frequently updated. So if, for instance, you go to Google Maps or any other online map source, you won’t find a map from the year 2000 even, because its updated to its current status – the old maps disappear off the system almost immediately. On Google Earth, they have introduced a feature where you can go back and look at old imagery, but you can’t do the same with maps. So if the streets in your neighbourhood changed and you wanted to know what they were like five years ago, you wouldn’t able to find out.
When I first arrived at UCT in the late 1970s and overlapped with Talbot for two years as a professor, the Geography Department employed two cartographers, Ken Behr and Andy Vinnecombe, who drew the maps, as well a dedicated map curator, Sam Johnson. In addition there was an entire cartography laboratory, which included a darkroom and a massive five-or-six- metre long camera with huge lenses. The camera was built into two rooms that were specially designed for it. It was used to make the lithographic plates on heavy-duty film from which you’d print off the maps, the negative sheets were about a square metre in size.
You have no idea the amount of work that used to go into producing a map. You would go out into the field with your surveying instruments – a plane table or a tape measure and a compass – to plot where things were in the landscape, then come back and give it to the cartographers. Otherwise you’d work from aerial photographs. You had to learn how to work with aerial photographs ¬– how to correct them for tilt and focal-length variation – which is all done automatically on Google Earth these days
‘There was an entire cartography laboratory, which included a massive darkroom and a five-or-six- metre long camera with huge lenses that had to take absolutely flat pictures.’
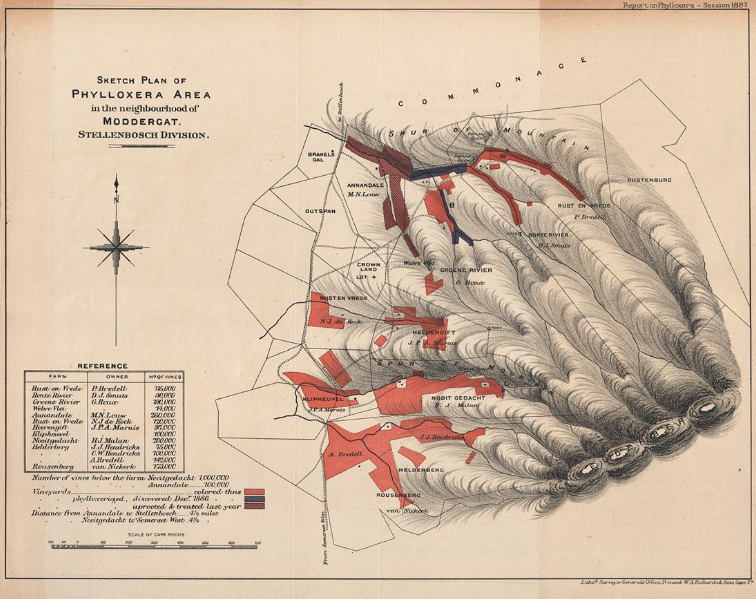
This cartography unit and map collection served the entire university. It was before the days of mapping on computers and the Geology Department, the Botany Department, the School of Environmental Studies – we all had to go to this cartography unit to have all our diagrams and maps drawn. Lecturers would come to the map unit to book out great big, hanging wall maps. If you were giving a lecture on China you’d want the wall map of China, if you were a visiting lecturer from America, you’d want the map of the United States. The Collection featured a large number of wall maps – some three metres wide and two metres deep, they were very often brightly coloured.
‘Lecturers would come to the map unit to book out great big, hanging wall maps. If you were a giving a lecture on China you’d want the wall map of China.’
When the map collection was moved across to the Beattie Building (when the Geography Department was established there), the whole of the top floor of the building had to be strengthened to carry it because the maps were so heavy. There must have been 20 or 30 map cabinets each holding hundreds of maps.
But as technology changed, paper maps were no longer central to people’s research because they could get what they needed off the Internet or in digital form rather than on paper. Gradually, the demand for the materials decreased and the maps were used less and less for lectures. The cartographers’ positions were not renewed, the map librarian was not replaced, and eventually the collection was archived by the university. Prior to this digitisation project, we thought that was the end for the map collection.
‘People are now realising that, with new technology, it’s very difficult to go back and get a map of some years past.’
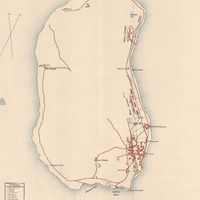
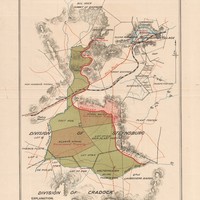
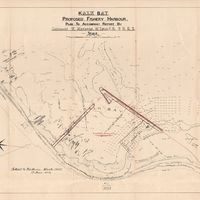
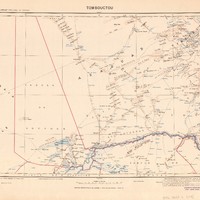
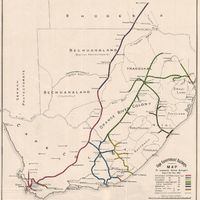
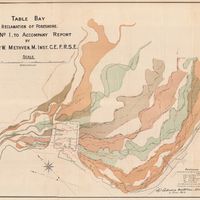
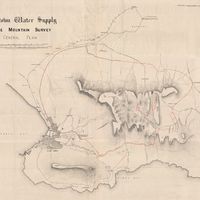
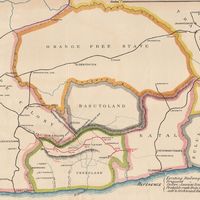
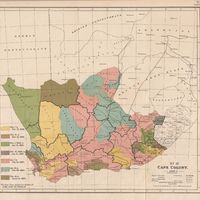
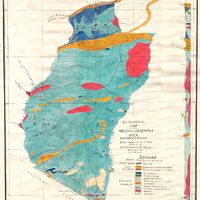
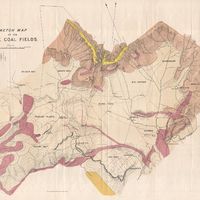
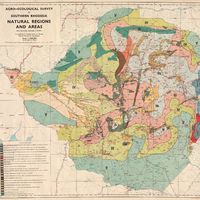
But people are now realising that, with new technology, it’s very difficult to go back and get a map of some years past. There are some fascinating maps in the collection, including military maps from World War II marked with tank routes and all sorts of things. This Humanitec project has made possible the digitisation of 500 maps from the university’s collection, which comprises around 5 000 maps overall, making available spatial information that can be used by people interested in historical research, or wanting to see spatial patterns from bygone times.






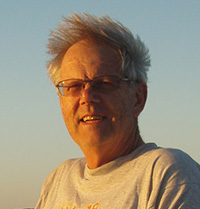 Richard Fuggle is an Emeritus Professor of the University of Cape Town. He was appointed as Professor of Environmental Studies in 1973, a post that he held until his retirement in 2006. Between 1973 and 1985 he was Director of the interdisciplinary School of Environmental Studies and between 1985 and 2000 was foundation Head of the Department of Environmental and Geographical Science. As Head of the EGS department, he assumed responsibility for maintaining and expanding the map collection initiated by Professor Talbot.